I recently attended DevOps Days Portland, where Kelsey Hightower gave a nice Keynote about NoOps. I had heard of the terms NoOps in passing before the conference but never really thought much about it or its implications. Kelsey’s talk started to get me thinking more and more about the idea and what it means to the DevOps world.
For those of you who aren’t familiar, NoOps is a newer tech buzzword that has emerged to describe the concept that an IT environment can become so automated and abstracted from the underlying infrastructure that there is no need for a dedicated team to manage software in-house.
Obviously the term NoOps has caused some friction between the development world and operations/DevOps world because of its perceived meaning along with a very controversial article entitled “I Don’t Want DevOps. I Want NoOps.” that kicked the whole movement off and sparked the original debate back in 2011. The main argument from people who work in operations is that there will always be servers running somewhere, as a developer you can’t just magically make servers go away, which I agree with 100%. It is incredibly short sighted to assume that any environment can work in a way where operations in some form need not exist.
Interestingly though, if you dig into the goals and underlying meaning of NoOps, they are actually fairly reasonable to me when boiled down. Here are just a few of them, borrowed from the article and Kelsey’s talk:
Improve the process of deploying apps
Not just VM’s, release management as well
Developers don’t want to deal with operations
Developers don’t care about hardware
All of these goals seem reasonable to me as an operations person, especially not having to work with developers. Therefore, when I look at NoOps I don’t necessarily take the ACTUAL underlying meaning of it be to work against operations and DevOps, I look at it as developers trying to find a better way to get their jobs done, however misguided their wording and mindset. I also see NoOps, from an operations perspective as a shift in the mindset of how to accomplish goals, to improve processes and pipelines, which is something that is very familiar to people who have worked in DevOps.
Because of this perspective, I see an evolution in the way that operations and DevOps works that takes the best ideas from NoOps and applies them in practical ways. Ultimately, operations people want to be just as productive as developers and NoOps seems like a good set of ideas to get on the same page.
To be able to incorporate ideas from NoOps as cloud and distributed technologies continue to advance, operations folks need to embrace the idea of programming and automation in areas that have been traditionally managed manually as part of the day to day by operation folks in order to abstract away complicated infrastructure and make it easier for developers to accomplish their goals. Examples of these types of things may include automatically provisioning networks and VLAN’s or issuing and deploying certificates by clicking a button. As more of the infrastructure gets abstracted away, it is important for operations to be able to automate these tasks.
If anything, I think NoOps makes sense as a concept for improving the lives of both developers and operations, which is one facet that DevOps aims to help solve. So to me, the goals of NoOps are a good thing, even though there has been a lot of stigma about it. Just to reiterate, I think it is absurd for anybody to say that jobs of operations will going away anytime soon, the job and responsibilities are just evolving to fit the direction other areas of the business are moving. If anything, the skills of managing cloud infrastructure, automation and building robust systems will be in higher demand.
As an operations/DevOps person just remember to stay curious and always keep working on improving your skill set.
The new Jenkins pipeline integration in 2.0 is pretty awesome and is a great way to add more automation to Jenkins.In this post we will set up Jenkins so that we can write our own custom libraries for Jenkins to use with the pipeline.
One huge benefit of the new pipeline integration in to the core components of Jenkins is the idea of a Jenkinsfile, which enables a way to automatically execute Jenkins jobs on the repo automatically, similar to the way TravisCI works. Simply place a Jenkinsfile in the root of the repo that you wish to automate, set up your webhook so that events to GitHub automatically trigger the Jenkins job and let Jenkins take care of the build.
There are a few very good guides for getting this functionality setup.
Unfortunately, while these guides/docs are very informative and useful they are somewhat confusing to new users and glaze over a few important steps and details that took me longer than it should have to figure out and understand. Therefore the focus will be on some of the details that the mentioned guides lack, especially setting up the built in Jenkins Git repo for accessing and working with the custom pipeline libraries.
Setup
There are many great resources out there already for getting a Jenkins server up and running. For the purposes of this post it will be assumed that you have already create and setup a Jenkins instance, using one of the other Digital Ocean [tutorials](https://www.digitalocean.com/community/tutorials/?q=jenkins).
The first step to getting the pipeline set up, again assuming you have already installed Jenkins 2.0 from one of the guides linked above, is to enable the Jenkins custom Git repo for housing unique pipeline libraries that we will write a little bit later on. There is a section in the workflow plugin tutorial that explains it, but is one of the confusing areas and is buried in the documentation so it will be covered in more detailed below.
In order to be able to clone, read and write to the built in Jenkins Git repo, you will need to add your SSH public key to the server. To do this, the first step will be to configure the server per the SSH plugin and configuring a port to connect to so that the repo can be cloned. This can be found in Jenkins -> Configuration. In this example I used port 2222.
As always security should be a concern, so make sure you have authentication turned on. In this example, I am using GitHub authentication but the process will be similar for other authentication methods. Also make sure you use best practices in locking down any external access by hardening SSH or using other ways of blocking access.
After the Git server has been configured, you will need to add the public key for your user in Jenkins. This was another one of the confusing parts initially. The section to add your personal SSH public key was buried in docs that were glossed over, the page can be found here. The location in Jenkins to add this key is located here,
Notice that we are using port 2222. This is the port we configured via the SSH plugin from above. The port number can be any port you like, just make sure to keep it consistent in the configuration and here.
Working with the pipeline
With the pipeline library repo cloned, we can write a simple function, and then add it back in to Jenkins. By default the repo is called workflowLibs. The basic structure of the repo is to place your custom functions is the vars directory. Within the vars directory you will create a .groovy file for the function and a matching .txt file any documentation of the command you want to add. In our example let’s create a hello function.
Create a hello.groovy and a hello.txt file. Inside the hello.groovy file, add something similar to the following.
echo ‘Hello world!’
Go ahead and commit the hello.groovy file, don’t worry about the hello.txt file.
git add hello.groovy
git commit -m “Hello world example”
git push (You may need to set your upstream)
Obviously this function won’t do much. Once you have pushed the new function you should be able to view it in the dropdown of pipeline functions in the Jenkins build configuration screen.
NOTE: There is a nice little script testing plugin built in as part of the pipeline now called snippet-generator. If you want to test out small scripts on your Jenkins server first before committing and pushing any local changes you can try out your script first in Jenkins. To do this open up any of your Jenkins job configurations and then click the link that says “Pipeline syntax” towards the bottom of the page.
Here’s what the snippet generator looks like.
From the snippet-generator you can build out quite a bit of the functionality that you might want to use as part of your pipeline.
Configuring the job
There are a few different options for setting up Jenkins pipelines. The most common types are the Pipeline or the Multibranch Pipeline. The Pipeline implements all of the scripting capabilities that have been covered so that the power of the Groovy scripting language can be leveraged in the Jenkins job as well as things like application life cycles (via stages) which makes CI/CD much easier.
The Multibranch Pipeline augments the functionality of the Pipeline by adding in the ability to index branches from SCM so that different branches can be easily built and tested. The Multibranch Pipeline is especially useful for larger projects that have many developers and feature branches being worked on because each one of the branches can be tracked separately so developers don’t need to worry as much about overlapping with others work.
Taking the pipeline functionality one step further, it is possible to create a Jenkinsfile with all of the needed pipeline code inside of a repo that so that it can be built automatically. The Jenkinsfile basically is used as a blueprint used to describe the how and what of a project for its build process and can leverage any custom groovy functions that you have written that are on the Jenkins server.
Using a the combination of a GitHub webhook and a Jenkinsfile in a Git repo it is easy to automatically tell your Jenkins server to kick off a build every time a commit or PR happens in GitHub.
Let’s take a look at what an example Jenkinsfile might look like.
node {
stage ‘Checkout’
// Checkout logic goes here
stage ‘Build’
// Build logic goes here
stage ‘Test’
// Test logic goes here
stage ‘Deploy’
// Deploy logic goes here
}
This Jenkinsfile defines various “stages”, which will run through a set of functions described in each stage every time a commit has been pushed or a PR has been opened for a given project. One workflow, as shown above, is to segment the job into build, test, push and deploy stages. Different projects might require different stages so it is nice to have granular control of what the job is doing on a per repo basis.
Bonus: Github Webhooks
Configuring webhooks in GitHub is pretty easy as well. SCM is fairly standard these days for storing source code and there are a number of different Git management tools so the steps should be very similar if using a tool other than GitHub. Setting up a webhook in GitHub can be configured to trigger a Jenkins pipeline build when either a commit is pushed to a branch, like master, or a PR is created for a branch. The advantages of using webhooks should be pretty apparent, as builds are created automatically and can be configured to output their results to various different communication channels like email or Slack or a number of other chat tools. The webhooks are the last step in automating the new pipeline features.
If you haven’t already, you will need to enable the GitHub plugin (https://wiki.jenkins-ci.org/display/JENKINS/GitHub+Plugin) in order to use the GitHub webhooks. No extra configuration should be needed out of the box after installing the plugin.
To configure the webhook, first make sure there is a Jenkinsfile in the root directory of the project. After the Jenkinsfile is in place you will need to set up the webhook. Navigate to the project settings that you would like to create a webhook for, select ‘Settings’ -> ‘Webhooks & services’ . From here there is a button to add a new webhook.
Change the Payload URL to point at the Jenkins server, update the Content type to application/x-www-form-urlencoded, and leave the secret section blank. All the other defaults should be fine.
After adding the webhook, create or update the associated job in Jenkins. Make sure the new job is configured as either a pipeline or multibranch pipeline type.
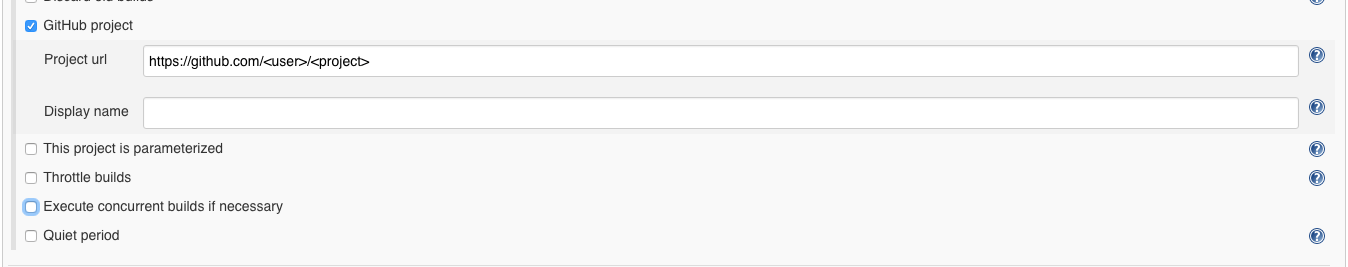
In the job configuration point Jenkins at the GitHub URL of the project.
Also make sure to select the build trigger to ‘Build when a change is pushed to GitHub’.
You may need to configure credentials if you are using private GitHub repos. This step can be done in Jenkins by navigating to ‘Manage Jenkins’ -> ‘Credentials’ -> ‘Global’. Then Choose ‘Add Credentials’ and select the SSH key used in conjunction with GitHub. After the credentials have been set up there should be an option when configuring jobs to use the SSH key to authenticate with GitHub.
Conclusion
Writing the Jenkinsfiles and custom libraries can take a little bit of time initially to get the hang of but are very powerful. If you already have experience writing Groovy, then writing these functions and files should be fairly straight forward.
The move towards pipelines brings about a number of nice features. First, you can keep track of your Jenkins job definition simply by adding a Jenkinsfile to a repo, so you get all of the nice benefits of history and version tracking and one central place to keep your build configurations. Because groovy is such a flexible language, pipelines give developers and engineers more options and creativity in terms of what their build jobs can do.
One gotcha of this process is that there isn’t a great workflow yet for working with the library functions, so there is a lot of trial and error to get custom functionality working correctly. One good way to debug is to set up a test job and watch for errors in the console output when you trigger a build for it. The combination of the snippet generator script tester though this process has become much easier.
Another thing that can be tricky is the Groovy sandbox. It is mostly and annoyance and I would not suggest turning it off, just be aware that it exists and often times needs to be worked around.
There are many more features and things that you can do with the Pipeline so I encourage readers to go out and explore some of the possibilities, the docs linked to above are a good place for exploring many of these features. As the pipeline matures, more and more plugins are adding the ability to be configured via the pipeline workflow, so if something isn’t possible right now it probably will be very soon.
This is a little follow up to a post I did awhile back about getting the ELK stack up and running using Docker. The last post was over a year ago and a lot has changed in regards to both Docker and the ELK stack.
All of the components of the ELK stack have gone through several revisions since the last post and all kinds of features and improvements have been made to all components (Elasticsearch, Logstash and Kibana). The current iteration is v5 for all of the components. v5 is still in alpha but that doesn’t mean we can’t get it up and running with Docker. NOTE: I don’t recommend trying to run ELK v5 in any kind of a setup outside of development at this point since it is still alpha.
Docker has evolved a little bit as well since the last post, which will help with some of the setup. The improvements in docker-compose will allow us to wrap the new Docker features up in the containers and leverage some cool Docker features.
Here is the updated elk-docker repo. Please open a PR or issue if you have ideas for improvement or if there are any issues you run into.
For the most part the items in the repo shouldn’t need to change unless you are interested in adjusting the Elasticsearch configuration or you want to update the Logstash input/filter/output configuration. The Elasticsearch config is located in es/elasticsearch.yml and the Logstash config is located in logstash/logstash.conf.
This configuration has been tested using Docker version 1.11 and docker-compose 1.7 on OS X.
Here’s what the docker-compose file looks like.
version: '2'
services:
  elasticsearch:
  image: elasticsearch:5
  command: elasticsearch
  environment:
    # This helps ES out with memory usage
    - ES_JAVA_OPTS=-Xmx1g -Xms1g
  volumes:
  # Persist elasticsearch data to a volume
    - elasticsearch:/usr/share/elasticsearch/data
    # Extra ES configuration options
    - ./es/elasticsearch.yml:/usr/share/elasticsearch/config/elasticsearch.yml
  ports:
    - "9200:9200"
    - "9300:9300"

  logstash:
  image: logstash:5
  command: logstash --auto-reload -w 4 -f /etc/logstash/conf.d/logstash.conf
  environment:
    # This helps Logstash out if it gets too busy
    - LS_HEAP_SIZE=2048m
  volumes:
    # volume mount the logstash config
    - ./logstash/logstash.conf:/etc/logstash/conf.d/logstash.conf
  ports:
    # Default GELF port
    - "12201:12201/udp"
    # Default UDP port
    - "5000:5000/udp"
    # Default TCP port
    - "5001:5001"
  links:
    - elasticsearch

  kibana:
  image: kibana:5
  environment:
    # Point Kibana to the elasticsearch container
    - ELASTICSEARCH_URL=http://elasticsearch:9200
  ports:
    - "5601:5601"
  links:
    - elasticsearch

  kopf:
  image: rancher/kopf:v0.4.0
  ports:
    - "8080:80"
  environment:
    KOPF_ES_SERVERS: "elasticsearch:9200"
  links:
    - elasticsearch

volumes:
  elasticsearch:
Notice that we are just storing the Elasticsearch data in a Docker volume called “elasticsearch”. Storing the data in a volume makes it easier to manage.
To start up the ELK stack just run docker-compose up” (plus -d for detatched) and you should see the ELK components start to come up in the docker-compose log messages. It takes about a minute or so to come up.
After everything has bootstrapped and come up you can see the fruits of your labor. If you are using the Docker beta app, (which I highly recommend) you can just visit localhost:5601 in your browser.
Bonus
To easily get some logs into ELK to start playing around with some data you can run the logspout container like I have below. This will forward the logs from the Docker daemon to Logstash for you automatically so that you can create a timestamp index in Logstash as above.
If you are testing locally with the Logtash adapter enabled, you can use the following docker + logspout command to populate logs into Elasticsearch and create an index automatically.
The value of <local_ip_address> should be the address of your laptop or desktop, which you can grab with ifconfig. Optionally you can add the debug flag to help troubleshoot issues by adding the following below the –publish line.
-env DEBUG=1
Then you can can check your local interface to make see packets being sent from logspout to Logstash using tcpdump. You might need to adjust lo0 to the interface used on the local machine by Docker.
sudo tcpdump -v -s0 -A -i lo0 port 5001
Alternatively, you can use curl if you enabled the http module in logspout.
That’s pretty much all there is to it. Feel free to tweak the configs if you want to play around with logstash or elasticsearch. And also please let me know if you have any ideas for improvement or have any issues getting this up and running.
If you’re not familiar already, Rancher is an orchestration and scheduling tool for containers. I have written a little bit about Rancher in the past but haven’t covered much on the specifics about how to manage a Rancher environment. One cool thing about Rancher is its “single pane of glass” approach to managing servers and containers, which allows users and admins to quickly and easily manage complicated environments. In this post I’ll be covering how to quickly and automatically add servers to your Rancher environment.
One of the manual steps that can(and in my opinion should) be automated is the server bootstrapping process. The Rancher web interface allows users to add hosts across different cloud providers (AWS, Azure, GCE, etc) and importantly the ability to add a custom host. This custom host registration is the piece that allows us to automate the host addition process by exposing a registration token via the Rancher API. One important thing to note if you are going to be adding hosts automatically is that you will need to actually create the entries necessary in the environment that you bootstrap servers to. So for example, if you create a new environment you will either need to programatically hit the API or in the web interface navigate to Infrastructure -> Add Host to populate the necessary tokens and entries.
Once you have populated the API with the values needed, you will need to create an API token to allow the server(s) that are bootstrapping to connect to the Rancher server to add themselves. If you haven’t done this before, in the environment you’d like to allow access to navigate to API -> Add Environment API Key -> name it and make a note of key that gets generated.
That’s pretty much all of the prep work you need to do to your Rancher environment for this method to work. The next step is to make a script to bootstrap a server when it gets created. The logic for this bootstrap process can be boiled down to the following snippet.
The script is pretty straight forward. It attempts to gather the internal IP address of the server being created, so that it can add it to the Rancher environment with a unique name. Note that there are a number of variables that need to get set to reflect. One that uses the DNS name of the Rancher server, one for the token that was generated in the step above and one for the project ID, which can be found by navigating to the Environment and then looking at the URL for /env/xxxx.
After we have all the needed information and updated the script, we can curl the Rancher server (this won’t work if you didn’t populate the API in the steps above or if your keys are invalide) with the registration token. Finally, start a docker container with the agent version set (check your Rancher server version and match to that) along with the URL obtained from the curl command.
The final step is to get the script to run when the server is provisioned. There are many ways to do this and this step will vary depending a number of different factors, but in this post I am using Cloud-init for CoreOS on AWS. Cloud-init is used to inject the script into the server and then create a systemd service to run the script the first time the server boots and use the result of the script to run the Rancher agent which allows the server to be picked up by the Rancher server and its environment.
Here is the logic to run the script when the server is booted.
The full version of the cloud-init file can be found here.
After you provision your server and give it a minute to warm up and run the script, check your Rancher environment to see if your server has popped up. If it hasn’t, the first place to start looking is on the server itself that was just created. Run docker logs -f rancher-agent to get information about what went wrong. Usually the problem is pretty obvious.
A brand new server looks something like this.
I typically use Terraform to provision these servers but I feel like covering Terraform here is a little bit out of scope. You can image some really interesting possibilities with auto scaling groups and load balancers that can come and go as your environment changes, one of the beauties of disposable infrastructure as well as infrastructure as code.
If you are interested in seeing how this Rancher bootstrap process fits in with Terraform let me know and I’ll take a stab at writing up a little piece on how to get it working.
If you haven’t already gotten in to the habit of linting your Dockerfiles you should. Code linting is a common practice in software development which helps find, identify and eliminate issues and bugs before they are ever able to become a problem. One of the main benefits of linting your code is that it helps identify and eliminate nasty little bugs before they ever have a chance to become a problem.
Taking the concept of linting and appyling it to Dockerfiles gives you a quick and easy way to identify errors quickly before you ever build any Docker images. By running your Dockerfile through a linter first, you can ensure that there aren’t any structural problems with the logic and instructions specified in your Dockerfiles. Linting your files is fast and easy (as I will demonstrate) and getting in the habit of adding a linting step to your development workflow is often very useful because not only will the linter help identify hidden issues which you might not otherwise catch right away but it can potentially save hours of troubleshoot later on, so there is some pretty good effort to benefit ratio there.
There are serveral other Docker linting tools around:
But in my experience, these tools have either been overly complicated, don’t detect/catch as many errors and in general just don’t seem to work as well or have as much polish as Hadolint. I may just have a skewed perspective of these tools but this was my experience when I tried them, so take my evaluation with a grain of salt. Definitely let me know if you have experience with any of these tools, I may just need to revisit them to get a better perspective.
With that being said, Hadolint offers everything I need and is very easy to use and get started with and makes linting your Dockerfiles is trivially easy, which counts for the most points in my experience. Another bonus of Hadolint is that the project is fairly active and the author is friendly, so if there are things you’d like to see get added, it shouldn’t be too hard to get some movement on. You can check out the project on Github for details about how to install and run Hadolint.
Below, I will go over how to get setup and started as well as some basic usage.
Install
If you use Mac OS X there is a brew formula for installing Hadolint.
brew update
brew install hadolint
If you are a Windows user, for now you will have to run Hadolint from within a Docker conainer.
docker run --rm -i lukasmartinelli/hadolint < Dockerfile
If you feel comfortable with the source code you can try building the code locally. I haven’t attempted that method, so I don’t have instructions here for how to do it. Go check out the project if you are interested.
Usage
Hadolint helps you find syntax errors and other mistakes that you may not notice in your Dockerfiles otherwise. It’s easy to get started. To run Hadolint run the following.
hadolint Dockerfile
If there are any issues, Hadolint will print out the rule number as well as a blurb describing what could potentially be wrong.
DL4000 Specify a maintainer of the Dockerfile
L1 DL3007 Using latest is prone to errors if the image will ever update. Pin the version explicitly to a release tag.
L3 DL3013 Pin versions in pip. Instead of `pip install <package>` use `pip install <package>==<version>`
As with any linting tool, you will definitely get some false positives at some point so just be aware of items that can potentially be ignored. There is an issue open on Github right now to allow Hadolint to ignore certain rules, which will help eliminate some of the false positives. For example, in the above snippet, we don’t necessarily care about the maintainer missing so it will be nice to be able to ignore that line.
Here is a complete reference for the all of the linting rules. The wiki gives examples of what is wrong and how to fix things, which is very helpful. Additionally, the author is welcoming ideas for additional things to check, so if you have a good idea for a linting rule open up an issue.
That’s it for now. Good luck and happy Docker linting!